
A Magnetic Reversal Around 2040?
The Galactic Current Sheet surface model gave us a local warp in the fitted surface that brings one part of the magnetic reversal much closer to the Solar System. The best fit local branch puts it here:
Present reversal distance ≈ 0.0241 pc ≈ 4,975 AUAnd when I propagate that fitted surface forward, the direct solution is:
Crossing year = 2039.818So, this is the direct solution, but what is the probability of this happening?
The Surface Model
This is based on Ben Davidson’s model [1] and has the following constraints:
Outward velocity = 700–2,000 km/s Vertical amplitude = 150–300 light-years Sheet thickness ≈ 30 light-yearsThe local warp solution that fits the observational reversal centers landed inside those ranges:
Fitted amplitude = 288.05 light-years Fitted outward velocity = 1,758.37 km/s Sheet thickness = 30 light-yearsThe local geometry is:
m = 2 zmid = 24.046 pc φ₀ = -1.181 rad kR = 39.828 rad/kpc RA = 0.5 kpcThe surface is still based on:
zGCS = zmid + A(R) sin(Φ)with:
A(R) = A₀ tanh(R / RA)and:
Φ = m(φ - φ₀) + kR RThe fit also needs a regional Solar neighborhood deformation:
Local deformation ≈ 20.28 pcThat local warp is what brings the magnetic reversal from the larger Galactic surface down to only a few thousand AU from us. The fitted branch has a current distance of about five thousand AU and a crossing near 2040.
GCS Current Location
I have calculated where the GCS currently is based on magnetic reversal data from pulsars. Pulsars give me two useful measurements:
DM = ∫ nₑ dsDM tells me how much ionized material is along the path. And:
RM = 0.812 ∫ nₑ B∥ dsRM also contains information about the direction of the magnetic field. By comparing pulsars at different distances, I can identify places where the magnetic field changes direction. That gave me:
17 independent magnetic-reversal locationsThose points are what I use to fit the larger GCS surface. I know it’s not a lot, but these 17 points give us good anchoring points, so we’re doing the best we can with the data we have available.
This is KEY: when I fit the large scale surface to the magnetic reversal data, it still sits too far from us for any near-term timing to work. So, I tested whether the sheet could have a local bend near the Solar System that the distant pulsar measurements would not resolve, and it can. The best fitting local bend brings the modeled reversal to about 5,000 AU away. That bend is a model result, not something we have directly observed yet. The next step is to look for independent local measurements that could confirm or rule it out.
This fit places the nearest magnetic reversal at:
0.02412 pc ≈ 4,975 AUand gives the unperturbed crossing at:
2039.818So, this is really important guys, the pulsar observations tell me how to fit the large scale magnetic eversal surface. The ~5,000 AU location comes from extending that fitted surface into the Solar neighborhood with the local warp solution. We have not directly measured a magnetic reversal 5,000 AU away yet. That is why current location is now the biggest uncertainty in the timing model. In the Monte Carlo, it accounts for about:
95.3% of the crossing-time uncertaintywhile velocity contributes about 5% and thickness essentially none. So the timing prediction is now giving me something to search for: if the 2040 solution is right, I should be able to find evidence that the local reversal is only about 5,000 AU away (this is what I’m trying to measure but I have to find an observatory that will let me use their instrumentation to search).
Probability Calculation
To calculate the probability, I used Monte Carlo simulations which is a common way statisticians propagate uncertainty in forecasting models. It’s a statistical method of finding the true answer. So I ran Monte Carlo simulations and I only changed the three things I’m currently treating as our largest uncertainties: 1) current reversal position, 2) outward velocity, and 3) sheet thickness.
For the main run, the current-position uncertainty was centered on:
0.02412 pc
≈ 4,975 AU

1σ ≈ 0.00603 pc
≈ 1,244 AU
Velocity was centered on:
1,758 km/s 1σ = 100 km/sAnd thickness was:
30 light-years 1σ = 3 light-yearsI ran:
1,000,000 Monte Carlo realizations per uncertainty levelEvery simulation was allowed to cross whenever the perturbed physics put it, and the run converged cleanly.
Results
Using the defined fitted GCS geometry I described above, I varied the current location of the reversal, its outward velocity, and the sheet thickness and with Monte Carlo simulations calculated the probability. These results are shown in Figure 1, and the most likely individual year is 2039, the cumulative probability reaches about 52% by 2039, 63% by 2040, 81% by 2042, and 92% by 2044. The biggest uncertainty is the present location of the reversal, not the velocity or thickness.
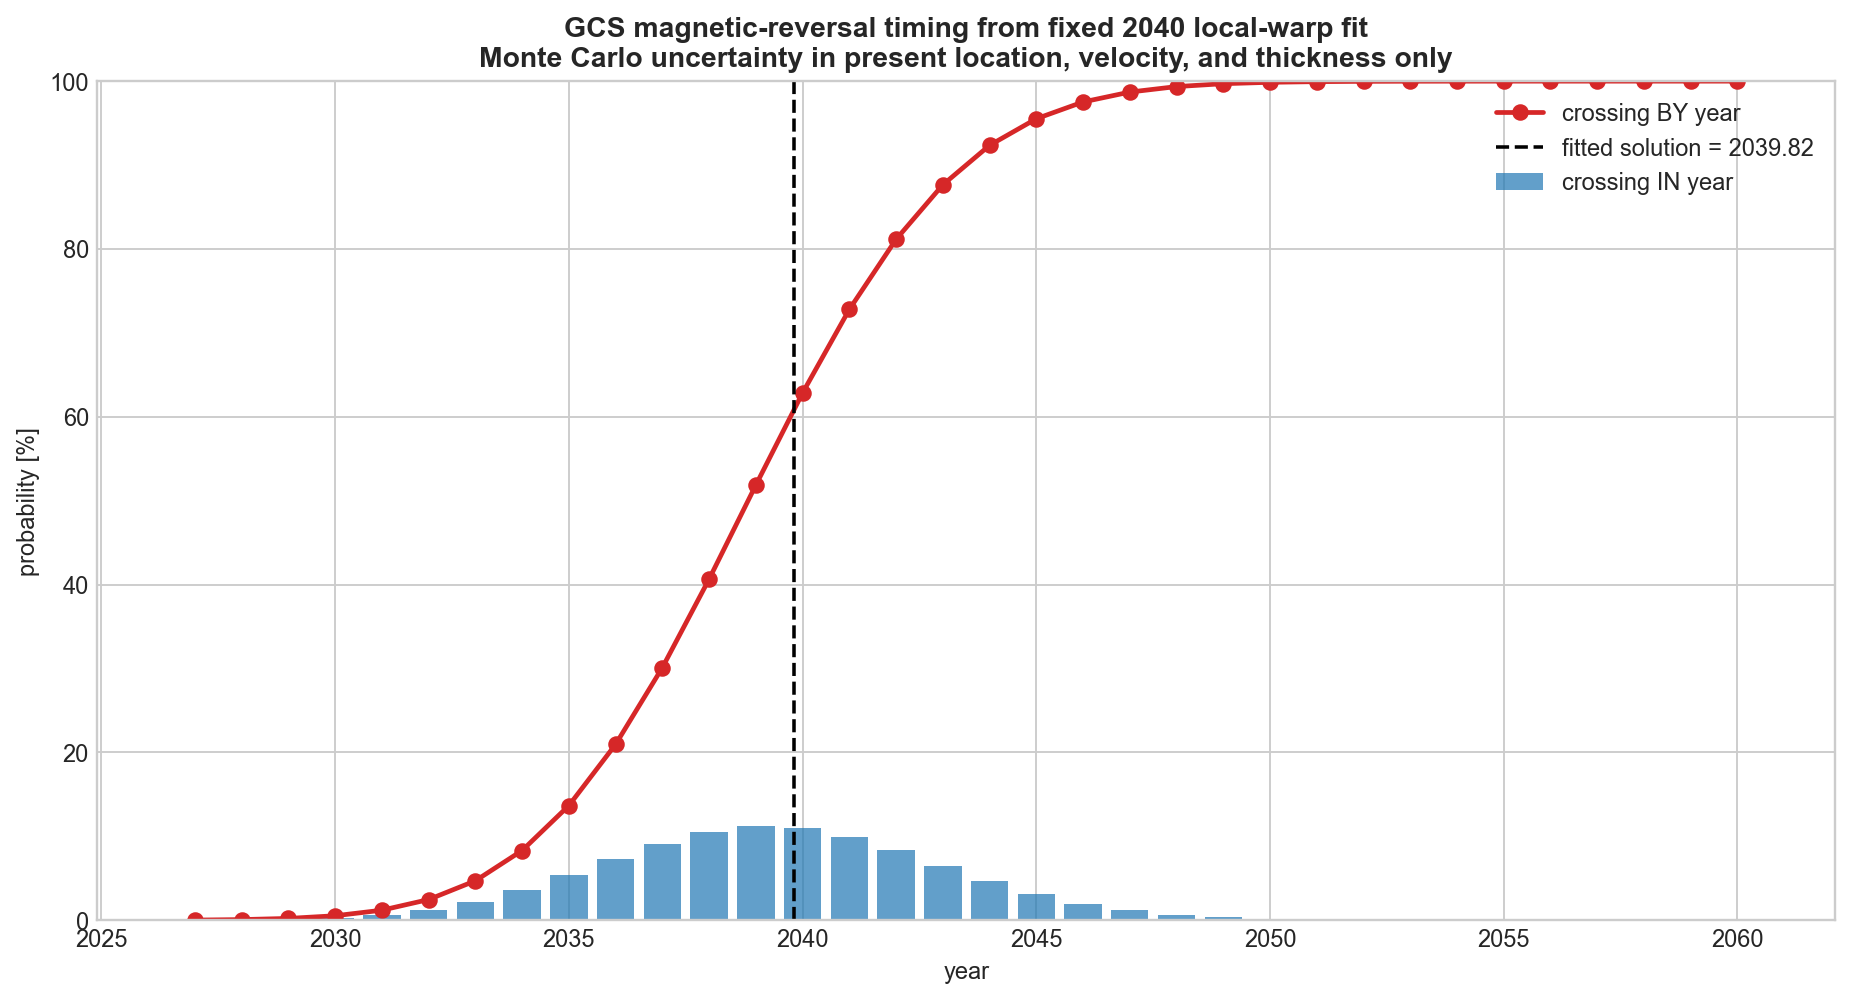
Figure 1. Blue bars indicate the probability of the crossing occurring in each individual year, while the red line shows the cumulative probability that the crossing has happened by that year. The fitted solution is 2039.82, and the simulations stay centered very close to that date.
So, the most likely individual year is:
2039 Probability of crossing during that year = 11.2%Now, there is an important distinction because this isn’t saying there is only 11% chance of a crossing, this is the probability of the crossing landing specifically inside that one calendar year.
The middle of the full timing distribution is:
Median crossing = 2039.83The central range containing about two-thirds of the simulations is:
68% range = 2036.35–2043.40And the broader range containing most of them is:
90% range ≈ 2034.1–2045.8Those results are centered almost exactly on the original fitted crossing.
I also calculated the cumulative probability which gives us the chance it happens BY the end of that year. That gives:
By 2038 = 40.7% By 2039 = 51.9% By 2040 = 62.8% By 2041 = 72.8% By 2042 = 81.1% By 2043 = 87.6% By 2044 = 92.4% By 2045 = 95.5% By 2046 = 97.5%So the halfway point is basically where the original fit already put it:
50% cumulative probability → 2039And the higher probability thresholds are:
75% → 2042 90% → 2044 95% → 2045And as I was calculating the probabilities, I determined what our biggest uncertainty is : it’s where the magnetic reversal is right now.
Timing uncertainty from current position ≈ 95.3%

Timing uncertainty from velocity ≈ 5.0%

Timing uncertainty from thickness ≈ 0%
If I change only the current position, the central crossing range becomes:
2036.38–2043.25If I change only the velocity:
2039.10–2040.64And changing only thickness doesn’t move the magnetic reversal date at all in this model. That tells me exactly what I need to work on next.
Next
For the fitted crossing to occur around 2040, the reversal should currently be roughly:
0.0244 pc away ≈ 5,040 AUFor comparison:
2035 crossing → ≈ 3,240 AU away now

2045 crossing → ≈ 6,840 AU away now

2050 crossing → ≈ 8,640 AU away now
So our validation problem is now narrowing down where this local magnetic reversal actually is. Because if I can measure that, the timing uncertainty collapses very quickly.
One last note: these are timing probabilities within this fitted local warp GCS model. They aren’t probabilities that the GCS hypothesis itself is correct, and they aren’t probabilities of any proposed solar response after the magnetic reversal.
References
[1] Davidson, B. (2025). The Sun, the Earth and the Disaster Cycle. Space Weather News, LLC
